
ABSTRACT
Objective To identify causal risk factors for Alzheimer’s disease and clarify which may instead be modified by emerging Alzheimer’s disease pathophysiology.
Method We performed a phenome-wide association study (PheWAS) of a polygenic risk score (p≤5×10⁻⁸) for Alzheimer’s disease with a wide range of phenotypes in the UK Biobank, stratified by age tertiles. We also investigated the association between the polygenic risk score for Alzheimer’s disease and previously implicated risk factors. Using two-sample bidirectional Mendelian randomization, we then estimated the size of causal effects of both previously implicated risk factors and those identified by the PheWAS on the risk of Alzheimer’s disease.
Results Genetic liability for Alzheimer’s disease was associated with red blood cell indices and cognitive measures in the youngest age tertile. In the middle and older age tertiles, higher genetic liability for Alzheimer’s disease was associated with medical history (e.g. atherosclerosis, use of cholesterol-lowering medications), physical measures (e.g. body fat measures), blood cell indices (e.g. red blood cell distribution width), cognition (e.g. fluid intelligence score) and lifestyle (e.g. self-reported moderate activity and daytime napping). In follow-up analyses using Mendelian randomization, we replicated established risk factors for Alzheimer’s disease (e.g. fluid intelligence score, education) and identified several novel risk factors (e.g. forced vital capacity, self-reported moderate physical activity and daytime napping).
Conclusion Genetic liability for Alzheimer’s disease is associated with over 160 phenotypes. However, findings from Mendelian randomization analyses imply that most of these associations are likely to be caused by increased genetic risk for Alzheimer’s disease or selection, rather than a cause of the disease.
INTRODUCTION
Alzheimer’s disease is a late-onset irreversible neurodegenerative disorder, constituting the majority of dementia cases [1], which affects 47 million people worldwide [2]. Genetic, molecular and clinical evidence suggests that pathophysiological changes occur two to three decades prior to the manifestation of clinical symptoms [3,4]. There are currently no disease-modifying therapeutics or preventative treatment for Alzheimer’s disease. Educational attainment is one of the few modifiable risk factors with evidence of a causal effect on Alzheimer’s disease [5]. Several quasi-experimental studies have shown that higher educational attainment reduces risk of Alzheimer’s disease [6–8]. Observational studies have reported conflicting evidence for the association of cardiovascular risk factors such as obesity, blood pressure, lipids [9–15] with incident Alzheimer’s disease across different age groups.
However, observational associations may be biased by confounding and reverse causation and Mendelian randomization can potentially overcome these issues. Mendelian randomization [16] is a form of instrumental variable analysis which uses genetic variants as proxies for environmental exposures. It can provide evidence about lifetime effects of factors on risk of Alzheimer’s disease and is robust to many forms of bias that can affect other observational study designs. In two-sample Mendelian randomization, the effect of genetic instrumental variables on the exposure and on the outcome are estimated in two separate samples. Mendelian randomization is based on three key assumptions [17]: (i) the genetic variant is strongly associated with the exposure, (ii) there are no confounders of the genetic variant-outcome association, and (iii) the effects of the genetic variant on the outcome are mediated entirely by the exposure. To date, hypothesis-driven Mendelian randomization studies have found mixed evidence for a causal role of cardiovascular risk factors in the development of Alzheimer’s disease [8,18,19].
Linkage studies identified the ε4 allele of the apolipoprotein E (APOE) gene increased the risk of Alzheimer’s disease up to twelvefold [20,21]. More recently, large genetic consortia have identified common genetic variants associated with late-onset Alzheimer’s disease [22]. While non-APOE genetic variants are more weakly associated with disease (odds ratio<1.2), they can be aggregated to generate a polygenic risk score for Alzheimer’s disease [23]. Previous work suggested that a polygenic risk score including single nucleotide polymorphisms (SNPs) at a p-value threshold≤0.5 had a better predictive accuracy (78.2%), explaining 2% of the variance in Alzheimer’s disease, compared with polygenic risk scores at lower p-value thresholds [24]. Polygenic risk scores indicate genetic liability for Alzheimer’s disease (regardless of whether an individual will or has developed Alzheimer’s disease).
They can be used to investigate the association between genetic liability for Alzheimer’s disease and other diseases or traits to, identify, or confirm traits that modify disease risk, establish protopathic effects of disease and identify biomarkers that predict disease.
Phenome-wide association studies (PheWAS) are based on a hypothesis-free approach, similar to the one used for genome-wide association studies (GWAS), and estimate the association between a genotype or polygenic risk score and a large array of phenotypes [25]. In contrast to hypothesis-driven analyses, the use of an agnostic approach in analyses allows for the discovery of novel associations with no prior belief of an association, and minimises publication bias, as all the findings are published [26,27]. Consequently, this method may provide new evidence about the etiology of Alzheimer’s disease but to date it has not been investigated in this manner.
In our study, we divided the UK Biobank participants (N=334,968) into three equal subsamples and conducted phenome-wide analysis within each tertile to investigate whether the association of genetic liability for Alzheimer’s disease with various phenotypes differed by age (Fig 1a). To delineate whether associated phenotypes could be causing the disease or be a consequence of the disease process, we also estimated the effect of the phenotypes identified from the PheWAS on Alzheimer’s disease using Mendelian randomization (Fig 1b).

Diagram (A) describes our study design when conducting a phenome-wide association study (PheWAS) and diagram (B) describes our study design when using Mendelian randomization. In (A), the polygenic risk score for Alzheimer’s disease may either have a downstream causal effect on the trait (e.g. body mass index), or it may affect the trait through pathways other than through Alzheimer’s disease (i.e. pleiotropic effects). Diagram (B) describes our follow-up analysis using Mendelian randomization to establish causality and directionality of the observed associations. In (2), we test the hypothesis that the trait (e.g. body mass index) is causally associated with Alzheimer’s disease, provided that the conditions (i), (ii), and (iii) are adequately satisfied, governing that the polygenic risk score for the trait of interest is a valid instrument, in that (i) the polygenic risk score for a trait is robustly associated with the trait it proxies, (ii) it is not associated with measured or unmeasured confounders of the trait, and (iii) its association with the outcome is conditional on the trait.
METHODS
Study design
Our analysis proceeded in two steps. First, we ran a PheWAS of the Alzheimer’s disease polygenic risk score and all available phenotypes in UK Biobank, stratifying the sample by age. Second, we followed-up all phenotypes associated with the polygenic risk score using two-sample Mendelian randomization. We outline the different research questions answered by the PheWAS and the Mendelian randomization approach in Fig 1.
Sample description
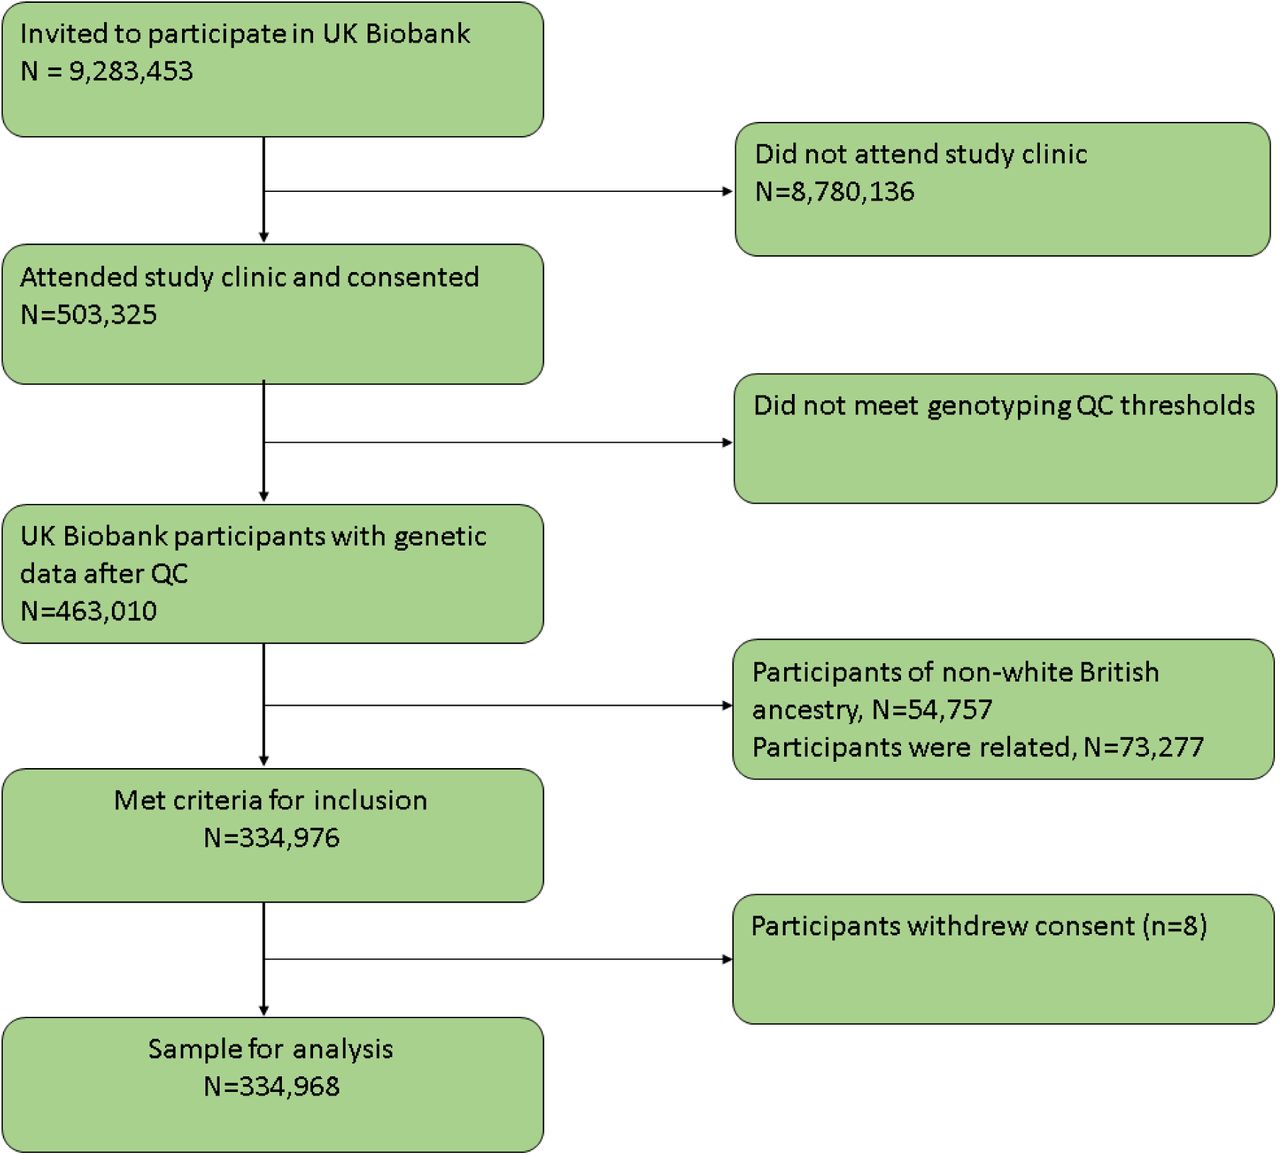
UK Biobank is a population-based health research resource consisting of 503,325 people, aged between 38 years and 73 years, who were recruited between the years 2006 and 2010 from across England, Wales, and Scotland [28]. The study was designed to identify determinants of human diseases. A full description of the study design, participants and quality control (QC) methods have been published previously [29]. UK Biobank received ethical approval from the Research Ethics Committee (REC reference for UK Biobank is 11/NW/0382). Of the 463,010 participants with genetic data (already quality checked and excluding participants with sex mismatch or sex aneuploidy), 54,757 were of non-white British ancestry, 73,277 participants had a kinship coefficient denoting a third-degree relatedness, and eight participants withdrew consent (Fig 2). In total, a sample of 334,968 remained after QC. This work was done under application number 16729 (version 2 genetic data [500 K with HRC imputation] and phenotype dataset 21753).

UK Biobank participant flow diagram
Polygenic risk score
We constructed a polygenic risk score including SNPs associated with Alzheimer’s disease at genome-wide significance (p≤5×10⁻⁸) for UK Biobank participants based on the summary statistics from a meta-analysis of the IGAP consortium [30], ADSP [31] and PGC [32], totalling 24,087 individuals with a clinical diagnosis of Alzheimer’s disease, paired with 55,058 controls. Further details on the samples used can be found in the Supplementary material. SNPs were clumped using r2>0.001 and a physical distance for clumping of 10,000 kb (Supplementary Fig 1). A polygenic risk score was calculated for each participant with genetic data using PLINK (version 1.9). Each score was calculated from the effect size (logarithm (log) odds)-weighted sum of associated alleles within each participant. A list of 18 SNPs used to generate the polygenic risk score is provided in Supplementary table 1. Our main analysis is based on the polygenic risk score with the APOE region. The polygenic risk score was standardised by subtracting the mean and dividing by the standard deviation of the polygenic risk score.
Main analysis
The full UK Biobank sample was divided into three equal subsamples (n=111,656 in each tertile). We performed PheWAS within each tertile. Age and sex were reported at recruitment and confirmed by genetic data were included as covariates in the models to reduce variation in the outcomes. We adjusted for the first 10 genetic principal components to control for confounding due to population stratification.
Outcomes
The Biobank data showcase enables researchers to identify variables based on the field type (http://biobank.ctsu.ox.ac.uk/showcase/list.cgi). At the time of data usage, there were 2,655 fields of the following types: integer, continuous, categorical (single) and categorical (multiple). We excluded 55 fields (Supplementary table 2) a priori because: a) 3 fields described age, b) 17 fields described the genetic data, c) 17 fields denoted assessment centre environment variables, and d) 18 categorical (single) fields reported more than one value per individual.
STATISTICAL ANALYSES
Phenome-wide association study
We estimated the association of an Alzheimer’s disease polygenic risk score with each phenotype in the three age strata using the PHESANT package (version 14). A detailed description of PHESANT’s automated rule-based method is published elsewhere [27] and a brief description can be found in the Supplementary material. The polygenic risk score for Alzheimer’s disease and phenotypes are independent (exposure) and dependent (outcome) variables in the regression model, respectively. Outcome variables with continuous, binary, ordered categorical, and unordered categorical data types were tested using linear, logistic, ordered logistic, and multinomial logistic regression, respectively. Before testing, an inverse normal rank transformation was applied to continuous variables to ensure a normal distribution. We accounted for the multiple tests performed by generating a 5% false discovery rate adjusted p-value threshold. After ranking the results by p-value, we identified the largest rank position with a p-value less than Pthreshold=0.05×rank/n, where n is number of total number of tests in the phenome scan. Pthreshold is the p-value threshold controlling the false discovery rate at 5% [33] and was used as a heuristic to identify phenotypes to follow-up in the Mendelian randomization analysis and not as an indicator of significance [34,35]. Categories for the ordered categorical variables are in Supplementary table 3.
Risk factors implicated in Alzheimer’s disease in previous research
We investigated whether previously implicated risk factors for Alzheimer’s disease, that were not detected in the PheWAS, were associated with the polygenic score. We extracted a list of factors from the Global Burden of Disease Study for Alzheimer’s disease [36] and a literature review of the evidence on modifiable risk factors for cognitive decline and dementia from observational studies and randomised controlled trials [37]. We selected four factors from the Global Burden of Disease Study (high BMI, high fasting plasma glucose, smoking, and a high intake of sugar-sweetened beverages) that contributed to metrics for deaths, prevalence, years of life lost, years of life lived with disability, and disability-adjusted life-years due to Alzheimer’s disease. The review identified the following as potentially modifiable risk factors for dementia; less education, midlife hypertension, obesity and hearing loss, as well as later life smoking, depression, physical inactivity, social isolation, and diabetes. Furthermore, a meta-analysis of case-control and population-based studies showed that rheumatoid arthritis is associated with lower incidence of Alzheimer’s disease [38]. The relationship between Alzheimer’s disease and rheumatoid arthritis has been studied before using genetic-based methods such as Mendelian randomization [38], hence it is not examined here. We examined the use of methotrexate (anti-inflammatory drug for rheumatoid arthritis) due to observational studies [39,40] suggesting anti-inflammatory medicines for rheumatoid arthritis reduces risk of Alzheimer’s disease [39]. At the time of the analysis, plasma glucose was not available and was not investigated.
Sensitivity analysis
We repeated the PheWAS for the entire sample, irrespective of age. This was performed to maximise power to detect associations. Furthermore, to examine if any detected associations could be attributed to the variants in or near the APOE gene (Chr 19: 44,400 kb-46,500 kb) which is known to have widespread physiological effects (i.e. highly pleiotropic), we repeated the PheWAS on the entire sample using the polygenic risk score excluding SNPs in the APOE region.
Follow-up using Mendelian randomization
We investigated whether the phenotypes identified in our PheWAS caused or were caused by Alzheimer’s disease using bidirectional two-sample Mendelian randomization. Of the 177 phenotypes identified in the PheWAS and previously implicated risk factors not identified in the PheWAS, we followed up 87 phenotypes, respectively, using two-sample bidirectional Mendelian randomization. We did not follow up all 90 phenotypes identified in the PheWAS because of either low prevalence, no genetic instruments, or if they indicated own diagnosis or family history of Alzheimer’s disease. For wheeze/whistling, we also examined the measured phenotype of forced vital capacity as a better measure of respiratory function. For spherical power, we derived four binary variables to indicate myopia (spherical power<-0.5) and hypertropia (spherical power>0.5) in each eye.
Data sources for the Mendelian randomization analyses
For each risk factor identified by the PheWAS and literature reviews, we performed GWAS to identify SNPs that are strongly associated (p≤5×10⁻⁸) with each trait. Exposure GWASs were based on summary statistics from UK Biobank, and were performed with the BOLT-LMM software package [41] using a published pipeline [42], described in detail in the Supplementary material. For body mass index, hip and waist circumference, we used summary statistics from the GIANT consortium as it had larger sample sizes than UK Biobank alone [43,44]. SNPs in the APOE region defined as the region between positions 44,400 kb-46,500 kb on chromosome 19 [45] were removed from instruments proxying the exposure, due to the highly pleiotropic effects of the APOE gene. We retained independent genome-wide significant SNPs that had an r2<0.001 with another variant within a 10 mb window using the 1000 genomes panel [46] and removed any ambiguous palindromic SNPs. Simulation studies [47] have shown inflation in BOLT-LMM tests statistics for unbalanced case-control analyses. Based on the results of these simulations, authors reported BOLT-LMM p-values are well-calibrated for a prevalence>10% and minor allele frequency>0.1%, and for lower prevalence of cases, BOLT-LMM only results in inflated statistics for rare variants. We retained phenotypes using the lowest examined prevalence in BOLT-LMM simulation studies (0.1%). The number of cases and controls for each binary phenotype is in Supplementary table 4.
Alzheimer’s disease GWAS
We used the same sample for the two-sample Mendelian randomization analyses as for the construction of the polygenic risk score for Alzheimer’s disease [32]. For these analyses, the APOE region was retained as Alzheimer’s disease is investigated as an outcome in this analysis.
Estimating the association between risk factors and Alzheimer’s disease
We harmonized the exposure and outcome GWAS; see the Supplementary material for details. We employed univariable Mendelian randomization to estimate the effect of each exposure on Alzheimer’s disease, using inverse-variance weighted regression analysis; this estimator assumes no directional horizontal pleiotropy [16]. We used the F-statistic as a measure of instrument strength [48]. The F-statistic is a function of R2 (amount of variance explained by the genetic variants and the sample size). We interpreted estimates derived from linear and ordered logistic models as a change in odds ratio for Alzheimer’s disease per 1 standard deviation in unit of exposure or category for ordered categorical variables. We present adjusted p-values for inverse variance weighted regression accounting for the number of results in the follow-up using the false discovery rate method.
Assessing pleiotropy
We investigated whether the SNPs had pleiotropic effects on the outcome other than through the exposure. We compared our results obtained from inverse variance weighted regressions, where the intercept is not constrained to zero, to those obtained with Egger regression [49,50]. Egger regression allows for pleiotropic effects that are independent of the effect on the exposure of interest [49,51,52]. The MR-Egger intercept estimates the average pleiotropic effect across the genetic variants. A non-zero intercept suggests presence of directional horizontal pleiotropy, and the estimated effect of the exposure obtained from MR-Egger regression allows for horizontal pleiotropy provided that the instrument strength independent of direct effect assumption (InSIDE) holds. We also report the I2Gx statistic [53], an analogous measure to the F-statistic in inverse variance weighted regression. The MR-Egger estimate is biased towards the null when the no measurement error assumption is violated, and the stronger the violation the larger the dilution (as indicated by lower I2Gx statistics).
Assessing causal direction
We used Steiger filtering to investigate the direction of causation between Alzheimer’s disease and the phenotypes [54]. Steiger filtering examines whether the SNPs for each of the phenotypes used in the two-sample Mendelian randomization explain more variance in the phenotypes than in Alzheimer’s disease (which should be true if the hypothesised direction from phenotype to Alzheimer’s disease is valid). We repeated Mendelian randomization analyses removing SNPs which explained more variance in the outcome than in the exposure.
RESULTS
Sample characteristics
The UK Biobank sample is 55% female (age range=39 to 53 years, mean=47.2 years, standard deviation=3.8 years) in tertile 1, 55% female (age range=53 to 62 years, mean=58.03 years, standard deviation=2.4 years) in tertile 2 and 49% female (age range=62 to 72 years, mean=65.3 years, standard deviation=2.7 years) in tertile 3. In the whole UK Biobank sample, the Alzheimer’s disease polygenic risk score was associated with a lower age at recruitment (β: −0.006 years; 95% CI: −0.01, −0.0002; p=0.007). The mean standardised polygenic risk score (95% CI) in each age tertile was as follows: 0.006 (−0.0003, 0.01); and 0.001 (−0.01, 0.009) and −0.007 (−0.02, 0.002) (P for trend=0.01).
Main Results
Selected PheWAS hits are presented in graphs and full results are in Supplementary file 2. PheWAS showed that the polygenic risk score for Alzheimer’s disease was associated with outcomes broadly categorised as dementia-associated medical history, medical history, physical measures, parental health factors, cognitive test and brain-related measures, biological sample measures, and lifestyle and dietary factors. Where we report results for continuous outcomes, these are in terms of a 1 standard deviation (SD) change of inverse rank normal transformed outcome (indicated by ‘ΔSD’), where we report results for binary or categorical outcomes these are in terms of log odds or odds (indicated by ‘logOR’ and ‘OR’).
Dementia-associated medical history
A higher polygenic risk score for Alzheimer’s disease was associated with higher odds of being diagnosed with unspecified Alzheimer’s disease (OR:2.39; 95% CI:1.83,3.11), vascular dementia (OR:1.92; 95% CI:1.65,2.24), or other forms of Alzheimer’s disease (atypical/mixed type) (OR:2.74; 95% CI:1.84,4.09), as well as higher odds of death from Alzheimer’s disease in the oldest age tertile (aged 62 to 72 years) (OR:2.50; 95% CI:1.86,3.35) (Supplementary Fig 2). A higher polygenic risk score was also associated with having a maternal and paternal history of Alzheimer’s disease/dementia for participants in all age tertiles examined, as well as a sibling history of Alzheimer’s disease/dementia for the two older age tertiles. Furthermore, we found strong evidence of a higher polygenic risk score being associated with higher odds of amnesia, disorientation, and symptoms involving cognitive function and awareness for the two older age groups.
Medical history
Participants with a higher polygenic risk score for Alzheimer’s disease were on average more likely to have been diagnosed with angina (OR: 1.05; 95% CI: 1.03, 1.08) and atherosclerotic heart disease (OR: 1.05; 95% CI: 1.03, 1.08) and to have used beta-blockers (e.g. atenolol) (OR: 1.04; 95% CI: 1.02, 1.07), as well as aspirin in all age tertiles (Supplementary Fig 2). In the two older tertiles (ages 53 to 72 years), participants with higher polygenic risk score were on average less likely to have had a cholecystectomy (gallbladder removal). Additionally, a higher polygenic risk score was associated with higher odds of having an aortocoronary bypass graft. At all ages, a higher polygenic risk score was associated with being more likely to have self-reported a history of high cholesterol (OR: 1.16; 95% CI:1.14, 1.18), a diagnosis of pure hypercholesterolaemia (OR:1.10; 95% CI: 1.09, 1.12), and using cholesterol-lowering drugs such as ezetimibe (OR:1.20; 95% CI:1.14, 1.27) or statins (OR: 1.11; 95% CI: 1.09, 1.13). For participants of ages 62 to 72 years, those with a higher polygenic risk score were more likely to use thrombin injections. This outcome was not observed in the younger age tertiles examined (39 to 53 and 53 to 62 years).
Physical measures
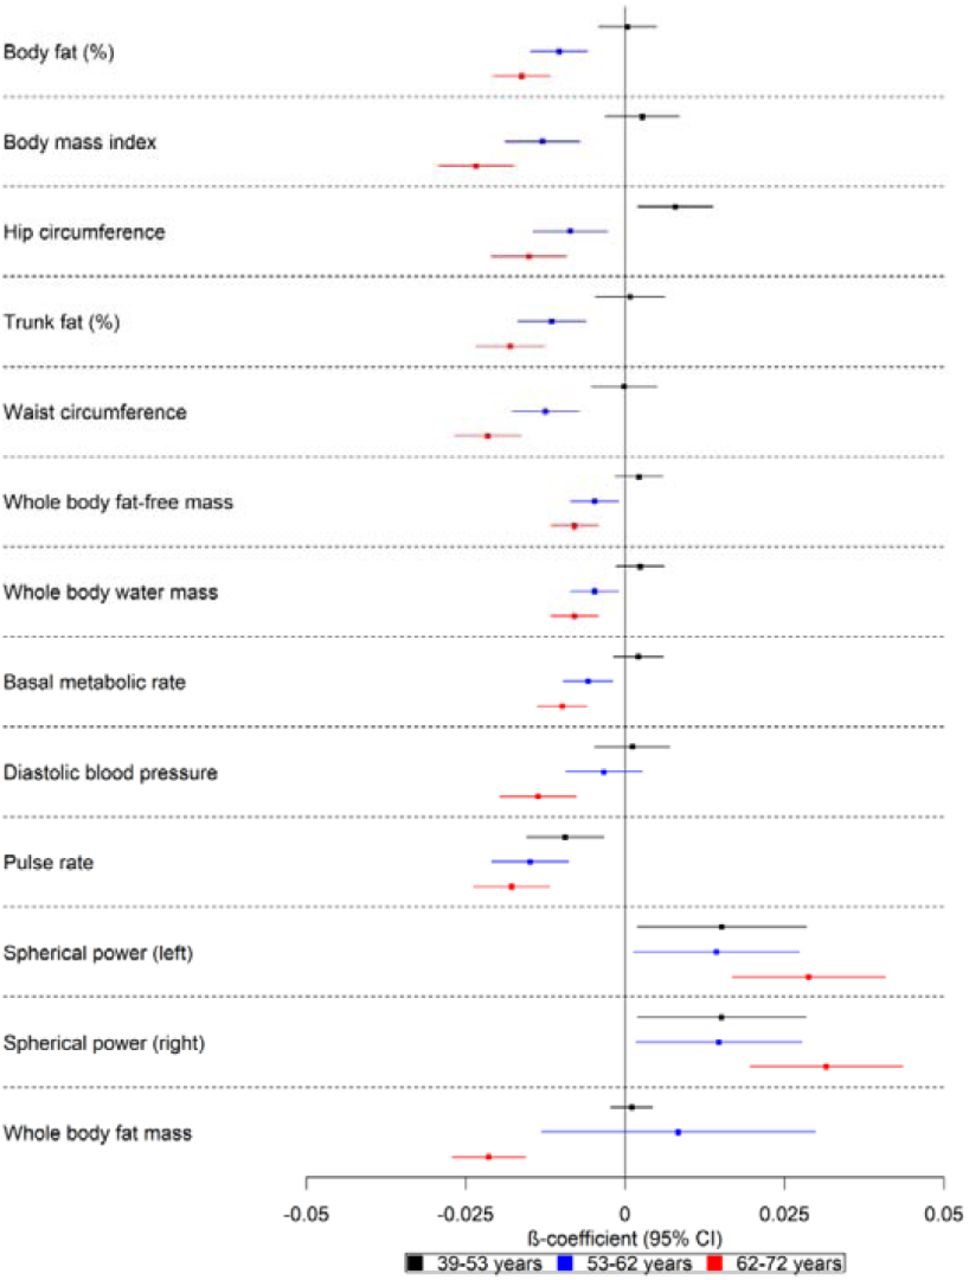
There was evidence that a higher polygenic risk score was associated with lower basal metabolic rate (ΔSD: −0.01; 95% CI: −0.01, −0.01), body fat percentage (ΔSD: −0.02; 95% CI: −0.02, −0.01), body mass index (ΔSD: −0.02; 95% CI: −0.03, −0.02), pulse rate (ΔSD: −0.02; 95% CI: −0.02, −0.01), waist circumference (ΔSD: −0.02; 95% CI: −0.03, −0.02), trunk fat percentage (ΔSD: −0.02; 95% CI: −0.02, −0.02), whole body fat (β: −0.02; 95% CI: −0.03, −0.02) and fat-free mass (ΔSD: −0.01; 95% CI: −0.01, −0.004), as well as whole body water mass (ΔSD: −0.01; 95% CI: −0.01, −0.004) in the two older age tertiles examined (Fig 3). There was weak evidence of such effects for the youngest participants. A higher polygenic risk score was associated with higher hip circumference in the younger participants (ages 39 to 53 years) (ΔSD: 0.01; 95% CI: 0.002, 0.01), but lower hip circumference (ΔSD: −0.02; 95% CI: −0.02,-0.01) for the two older age groups (ages 53 to 72 years). We also found evidence that a higher polygenic risk score was associated with higher spherical power in the oldest participants (i.e. strength of lens needed to correct focus). There was strong evidence that a higher polygenic risk score was associated with a lower diastolic blood pressure (ΔSD: - 0.01; 95% CI: −0.02, −0.01) in the oldest age tertile.

Forest plot showing the effect estimates for the association between the polygenic score for Alzheimer’s disease (including the apolipoprotein E region) and physical measures. Legends in the right of each graph indicate age tertiles. Effect estimates are shown by box markers and confidence bands represent 95% confidence intervals. There is evidence that the polygenic risk score for Alzheimer’s disease is related to physical measures in older, but not younger participants. This suggests that Alzheimer’s disease causes these changes rather than vice versa.
Parental health factors
On average, the parents of participants with a higher polygenic risk score for Alzheimer’s disease died at a younger age (ΔSD: −0.01; 95% CI: −0.02, −0.01) and had lower odds of the mother (OR: 0.91; 95% CI: 0.89, 0.93) and father (OR: 0.93; 95% CI: 0.89, 0.96) being still alive. Furthermore, a higher polygenic risk score was associated with lower odds of a paternal history of chronic bronchitis/emphysema (OR: 0.96; 95% CI: 0.94, 0.98), as well as lower odds of maternal history of high blood pressure (OR: 0.96; 95% CI: 0.95, 0.98) (Supplementary Fig 3). There was an age-dependent increase in effect size, and for some outcomes, the 95% CIs included the null value for the younger participants.
Cognitive test measures
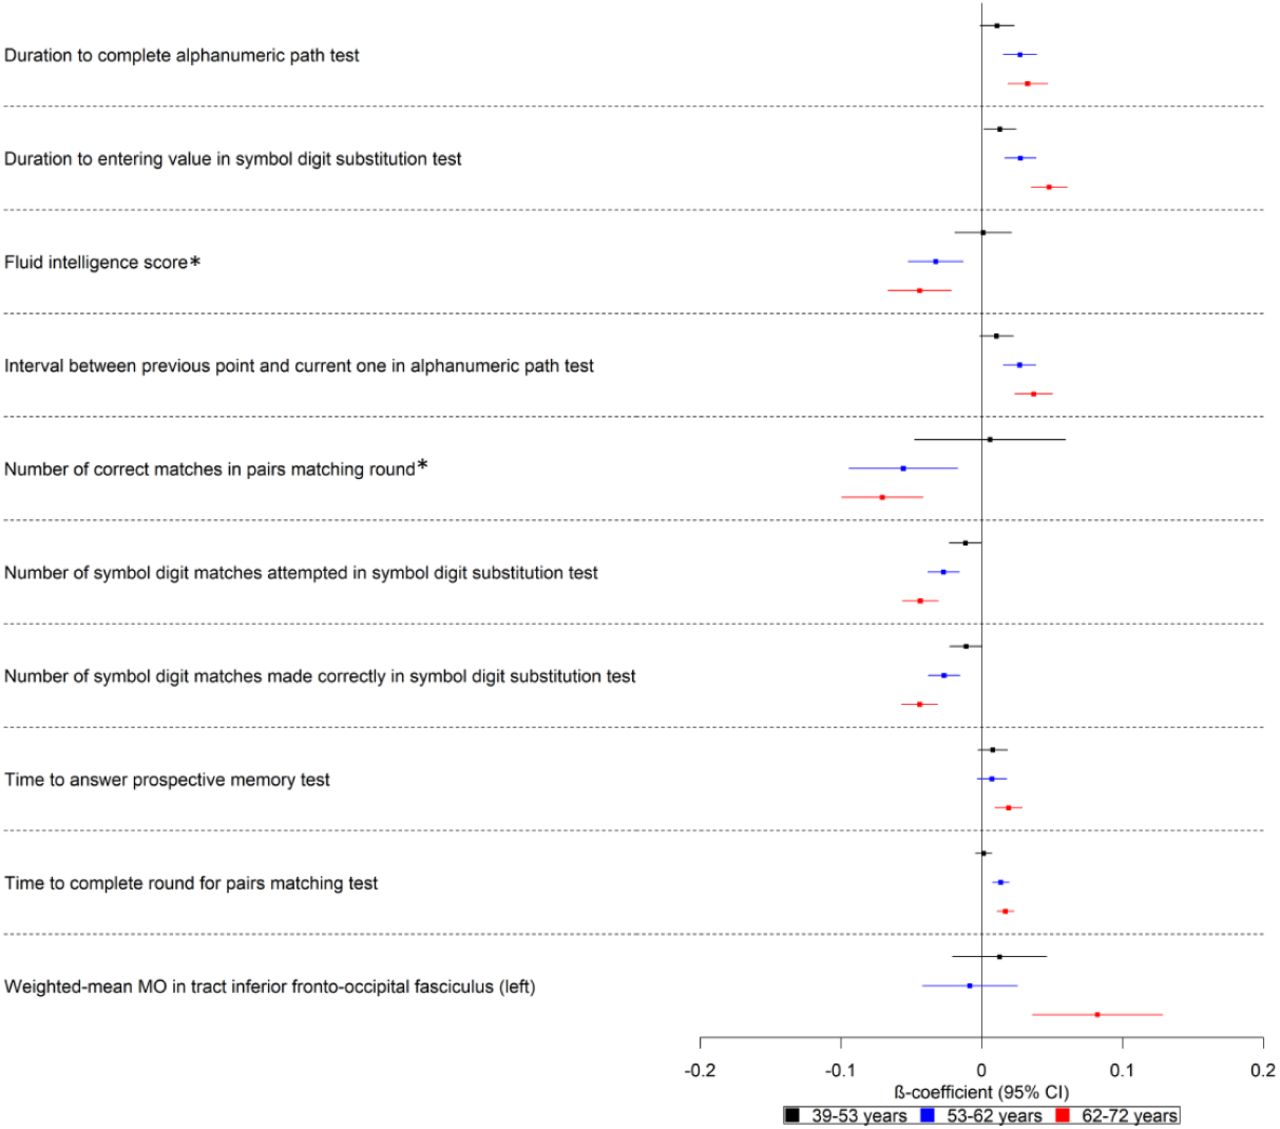
Participants with higher polygenic risk scores on average took longer to enter values and complete cognitive tests in all ages examined (39 to 72 years) (Fig 4). Furthermore, a higher polygenic risk score was associated with lower log odds of being in a higher scoring category for number of correct matches in pairs matching round (logOR: −0.07; 95% CI: - 0.10, −0.04) and being in a higher category for fluid intelligence score (logOR: −0.04; 95% CI: −0.07, −0.02) for participants of ages 53 to 62 and 62 to 72 years. Additionally, a higher polygenic risk score was associated with a higher weighted-mean mode of anisotropy (MO) in the left inferior fronto-occipital fasciculus (ΔSD: 0.08; 95% CI: 0.04, 0.13). There is an age-dependent increase in effect size for all these factors, with the effect being weaker for the younger participants of ages 39 to 53 years.

Forest plot showing the effect estimates for the association between the polygenic score for Alzheimer’s disease (including the apolipoprotein E region), cognitive, and brain-related measures. Legends in the right of each graph indicate age tertiles. Effect estimates are shown by box markers and confidence bands represent 95% confidence intervals. *Effect estimates were derived from ordered logistic models and effect estimates are on log odds scale. We found evidence that the polygenic risk score for Alzheimer’s disease is related to some cognitive measures in all age ranges examined. This may suggest a bidirectional relationship between cognitive measures and Alzheimer’s disease.
Biological measures
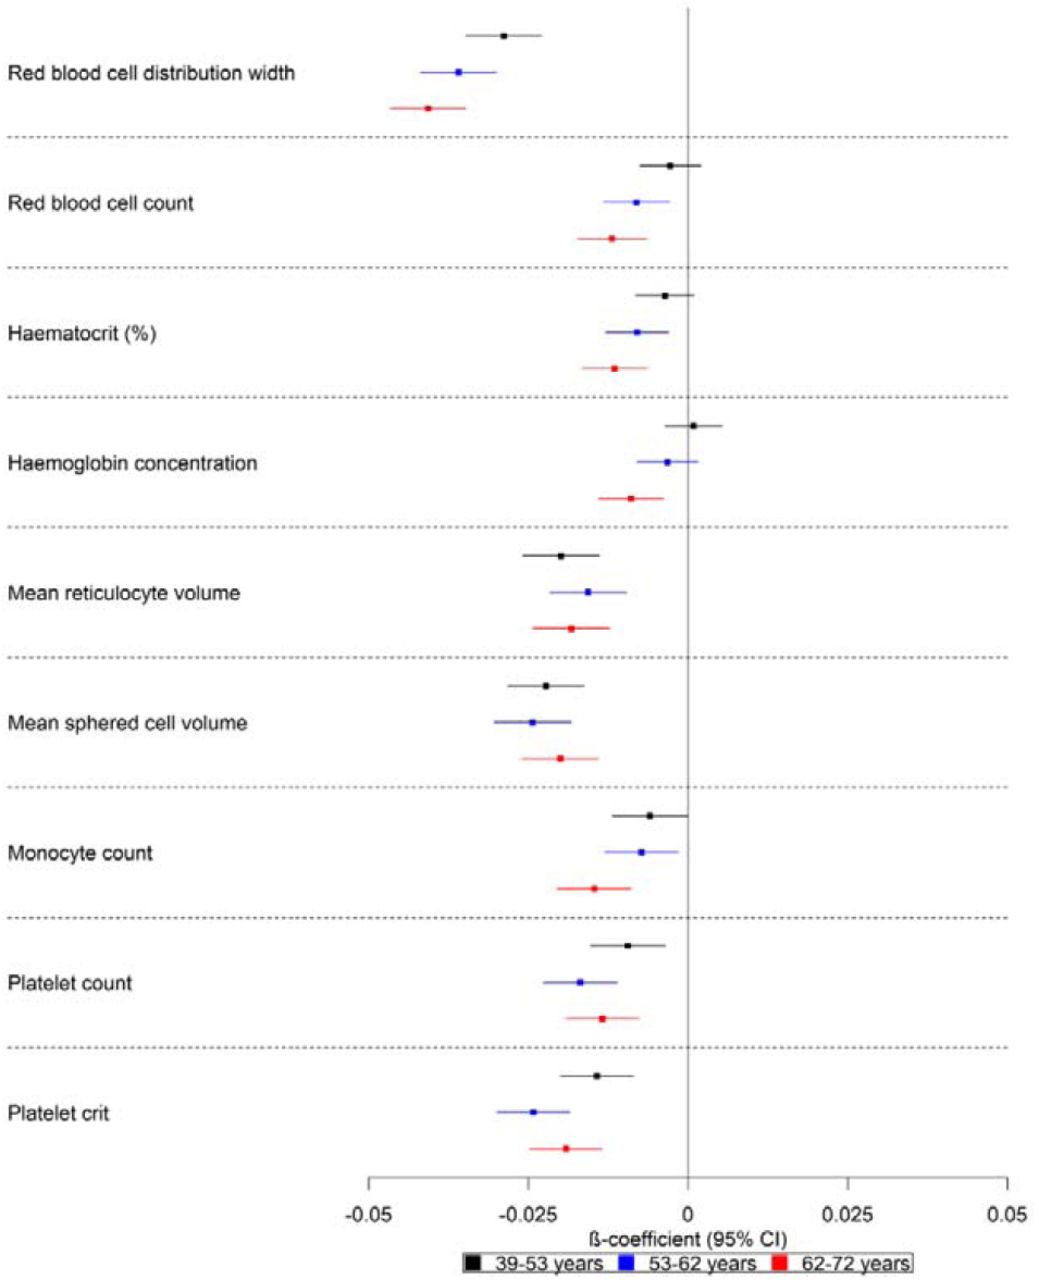
A higher polygenic risk score was associated with lower red blood cell count (ΔSD: −0.01; 95% CI: −0.02, −0.01), red blood cell distribution width (ΔSD: −0.04; 95% CI: −0.05, −0.03), haematocrit percentage (ΔSD: −0.01; 95% CI: −0.02, −0.01), haemoglobin concentration (ΔSD: −0.01; 95% CI: −0.01, −0.004), monocyte count (ΔSD: −0.02; 95% CI: −0.02, −0.01), platelet count (ΔSD: −0.01; 95% CI: −0.02, −0.01) and plateletcrit (ΔSD: −0.02; 95% CI: −0.02, −0.01) (Fig 5). These effects increased with age, except for platelet count and plateletcrit which showed similar estimates for all tertiles. Furthermore, although the trend was consistent for all listed factors, for red blood cell count and haemoglobin concentration, the 95% CIs included the null for the polygenic risk score of the younger participants (ages 39 to 53 years).

Forest plot showing the effect estimates for the association between the polygenic score for Alzheimer’s disease (including the apolipoprotein E region) and biological measures. Legends in the right of each graph indicate age tertiles. Effect estimates are shown by box markers and confidence bands represent 95% confidence intervals. There is an age-dependent increase in the effect of the polygenic risk score on blood-based measures. This may indicate that blood-based markers may be causal in the development of Alzheimer’s disease.
Dietary measures
There was strong evidence that a higher polygenic risk score was associated with dietary factors (Supplementary Fig 3). A higher polygenic risk score for Alzheimer’s disease in the oldest participants (ages 62 to 72 years) was associated with lower odds of eating eggs and dairy products, and higher odds of having a greater intake of salad or raw vegetables.
Evidence of such dietary choices was weaker in the younger participants (ages 39 to 62 years). Furthermore, a higher polygenic risk score for Alzheimer’s disease was also associated with increased odds of eating more non-oily fish and having a frequent variation in diet. There was evidence that a polygenic risk score for participants in all age tertiles was associated with reduced odds of being in a category for always adding salt to food, lower use of butter/spreadable butter, and higher odds of using cholesterol-lowering margarines such as Flora pro-active or Benecol. Furthermore, we observed that a higher polygenic risk score was associated with lower odds of being in a higher category for pork intake and lamb/mutton in all age tertiles.
Lifestyle measures
There was strong evidence that a higher polygenic risk score was associated with a greater frequency of walking for pleasure in the last 4 weeks (logOR: 0.02; 95% CI: 0.01, 0.04), reporting more days per week including moderate (logOR: 0.03; 95% CI: 0.02, 0.04) and vigorous activity (logOR: 0.02; 95% CI: 0.01, 0.03) and finding it easier to get up in the morning (logOR: 0.03; 95% CI: 0.02, 0.04) for participants of ages 53 to 72 years (Fig 6). Furthermore, a higher polygenic risk score was also associated with higher odds of making dietary changes due to illness in this age range. There was weak evidence of association for these factors in the youngest participants examined (age 39 to 53 years). For participants in the youngest and oldest tertiles (ages 39 to 53 and 62 to 72 years), those with a higher polygenic risk score were less likely to experience sleeplessness/insomnia (logOR: −0.03; 95% CI: −0.04, −0.02). For the oldest participants, those with a higher polygenic risk score reported having less sleep (logOR: −0.02; 95% CI: −0.03, −0.01) and being less likely to nap during the day (logOR: −0.03; 95% CI: −0.04, −0.02). The evidence for these factors was weaker for participants in the younger age ranges.

Forest plot showing the effect estimates for the association between the polygenic score for Alzheimer’s disease (including the apolipoprotein E region) and lifestyle measures. Legends in the right of each graph indicate age tertiles. Effect estimates are shown by box markers and confidence bands represent 95% confidence intervals. All effect estimates were derived from ordered logistic models. There is evidence of association for the polygenic risk score on lifestyle in the two older age groups examined (ages 62-72 years), suggesting these lifestyles are an effect of the disease process.
Previously implicated risk factors for Alzheimer’s disease
For previously implicated factors in Alzheimer’s disease, a higher polygenic risk score was associated with higher systolic blood pressure in the youngest participants (ages 39-53 years) (ΔSD: 0.01; 95% CI: 0.003, 0.01) but not for the older participants (ΔSD: 0.005; 95% CI: −0.001, 0.01; ages 62-72 years). Furthermore, a higher polygenic risk score was associated with a higher pulse pressure for participants in all age ranges (ΔSD: 0.02; 95% CI: 0.01, 0.02). We found little evidence of an association between the polygenic risk score and qualifications attained, social activities, anti-inflammatory treatment for rheumatoid arthritis, and sweetened beverages. There was some evidence of an association between the polygenic risk score and lower number of pack years of smoking for the older participants (ΔSD: −0.01; 95% CI: −0.02, −0.003) (Fig 7).

Forest plot showing the effect estimates for the association between the polygenic score for Alzheimer’s disease (including the apolipoprotein E region) and previously implicated risk factors for Alzheimer’s disease that did not pass the corrected p-value threshold for multiple testing. Legends in the right of each graph indicate age tertiles. Effect estimates are shown by box markers and confidence bands represent 95% confidence intervals. *Effect estimates were derived from ordered logistic models and effect estimates are on the log odds scale. †Effect estimates were derived from linear regression models and are on the log odds scale. ‡Effect estimates were derived from binary logistic regression models and are on the log odds scale. There is little evidence of an association for the polygenic risk score for Alzheimer’s disease and previously implicated risk factors for Alzheimer’s disease, except for pulse pressure, pack years of smoking, use of a hearing aid, and going to the pub or social club. Most of these associations appear in the older age group, suggesting these previously implicated factors for Alzheimer’s disease may be attributed to the disease process or frailty.
Sensitivity analysis
When we repeated the analysis using the polygenic risk score for the entire sample, we were able to detect more phenotypes (Supplementary Figs 4-7). For example, we found that participants with a higher polygenic risk score were more likely to develop Hodgkin’s lymphoma, have had acute tonsillitis, and a lower age at menarche (Supplementary Fig 4). However, as the number of cases was low for these phenotypes, the effect estimates were imprecise. We also identified that a higher polygenic risk score was associated with phenotypes indicating metabolic dysfunction such as diabetes and obesity (Supplementary Fig 4). Furthermore, we found evidence that a higher polygenic risk score was associated with a higher volume of grey matter in right and left intracalcarine and supracalcarine cortices (Supplementary Fig 6). We observed that a higher polygenic risk score was associated with more blood count measures biomarkers such as lower lymphocyte and white blood cell count. A higher polygenic risk score was also associated with higher corpuscular haemoglobin concentration, reticulocyte percentage, and platelet distribution width (Supplementary Fig 6). We found that a higher polygenic risk score was associated with lower frequency of depressed days during worst episode of depression (among those who reported prolonged feelings of sadness or depression or ever having had a prolonged loss of interest in normal activities), as well as lower odds of smoking tobacco on most days.
However, individuals were asked the frequency of depressed days only if they reported “yes” to questions of ever having had prolonged feelings of sadness or depression (field 20446) or of ever having prolonged loss of interest in normal activities (field 20441). We found little evidence that the polygenic risk score was associated with reporting “yes” to these two questions, suggesting collider bias is unlikely (OR: 1.00, 95% CI: 0.99,1.02) and OR:1.00, 95% CI:0.99, 1.01) (Supplementary Fig 7).
When we repeated the analysis removing SNPs tagging the APOE region from the polygenic risk score using the whole sample, the variance explained in the phenotypes was lower and we could not replicate most of the hits detected in tertile 3. There was still evidence that the non-APOE polygenic risk score was associated with lower number of correct matches in pairs matching rounds (Supplementary Fig 10). Other associations we found using the APOE-inclusive polygenic risk score which replicated in the non-APOE polygenic risk score were higher odds of being diagnosed with Alzheimer’s disease, and having a family history of Alzheimer’s disease (Supplementary Fig 8), as well as lower odds of a paternal and maternal chronic bronchitis/emphysema and of parents being still alive (Supplementary Fig 9).
Two-sample Mendelian Randomization of UK Biobank phenotypes on Alzheimer’s disease
We found little evidence that a higher genetic liability for own medical and family history of factors related to ill health (e.g. use of medications, diagnoses of conditions such atherosclerosis), as well as blood-based measures had a causal effect on Alzheimer’s disease (Table 1, Supplementary tables 10-11,14,15). Using 51 genetic instruments (F statistic=55.31), we found strong evidence that a higher genetically predicted hip circumference decreased the risk of Alzheimer’s disease (OR: 0.75; 95% CI:0.61,0.90). We also identified weak evidence that genetically predicted body fat percentage, whole body fat mass, trunk fat percentage, as well as whole-body fat free mass lowered risk of Alzheimer’s disease. For example, a one SD increase in genetically predicted whole body fat mass resulted in a 11% lower risk of Alzheimer’s disease (OR:0.89; 95% CI:0.76,0.99; no.SNPs=410) (Table 1, Supplementary table 12). Using 649 SNPs (F statistic=41.56), we also found weak evidence suggesting a one SD increase in genetically predicted whole body fat-free mass caused 16% lower risk of Alzheimer’s disease (Table 1, Supplementary table 12). Furthermore, using 251 SNPs we found that a higher genetically predicted forced vital capacity was causally associated with 22% lower odds for Alzheimer’s disease (OR:0.78;95% CI:0.67,0.90) (Table 1, Supplementary table 12). With 76 SNPs (F statistic=39.93), we found that a one standard deviation increase in genetically predicted fluid intelligence score reduced the odds of Alzheimer’s disease by 27% (OR:0.73; 95% CI:0.59,0.90) (Table 1, Supplementary table 13). Using 15 SNPs (F statistic=35.79), we observed that a higher genetic liability of doing more moderate physical activity (at least 10 minutes), but not self-reported vigorous activity, was causally associated with higher odds of developing Alzheimer’s disease (OR: 2.29; 95% CI:1.32, 3.98 and OR: 1.02; 95% CI: 0.33,3.18, respectively) (Table 1, Supplementary table 16). We also found a higher genetic liability (no. SNPs=89; F statistic=45.32) for napping during the day reduced the odds of developing Alzheimer’s disease by 26% (OR: 0.74, 95% CI:0.59,0.93). For previously implicated risk factors for Alzheimer’s disease, we found a higher genetic liability for having a college degree and A level qualifications reduced risk of Alzheimer’s disease. Furthermore, using 1 SNP, we found that a genetic liability for having a high hearing ability (speech reception threshold) was associated with lower odds of Alzheimer’s disease (OR:0.23, 95% CI: 0.06,0.91), but the effect estimate is extremely imprecise (Table 1, Supplementary table 17).
Estimates from Mendelian Randomization analysis of exposures on Alzheimer’s disease
Forward and reverse genetic associations of Alzheimer’s disease with the UK Biobank phenome (including previously implicated risk factors). + and – indicate the direction of the coefficient for phenotypes associated with Alzheimer’s disease using two-sample Mendelian randomization. X represents associations which were consistent with the null.
Assessing pleiotropy
Due to the large sample size of UK Biobank (in addition to other samples for some exposures), the instrument strength of all genetic variants was relatively high (F>30.10). However, the set of SNPs used for each of the body measures were highly heterogeneous (all heterogeneity Q statistic P<3.37×10⁻⁵), indicating that several of the SNPs may be horizontally pleiotropic. The causal effects were not consistent across SNPs, with some SNPs showing large effects on the outcome given the magnitude of association with the exposure (Supplementary Figs 12-16). We found evidence of heterogeneity in the causal effect estimates for forced vital capacity (Q statistic=404.47, p=4.0×10⁻⁶) (Supplementary table 12 and fig 17) and fluid intelligence score (Q statistic=133.88, p=3.46×10⁻⁵) (Supplementary table 13 and Fig 18). For napping during the day, we found little evidence that the instruments exhibited horizontal pleiotropy (Q statistic=89.47, p=0.44) (Supplementary table 16, Fig 19). Although the SNPs instrumenting both the exposures of having A level qualifications and a college degree display heterogeneity, the horizontally pleiotropic effects appear to be independent of the effects of the SNPs on the exposure (i.e. balanced horizontal pleiotropy) (Supplementary table 17, Fig 21-22).
Assessing causal direction
Using Steiger filtering, we did not find evidence that the instruments explained more variance in the outcome compared to the exposure for most exposures, corroborating the hypothesised causal direction from exposure to Alzheimer’s disease for results reported in the two-sample Mendelian randomization section. However, the effect estimates for Mendelian randomization analyses retaining only the SNPs with the true hypothesised causal direction using Steiger filtering attenuated for body fat percentage, whole body fat mass, whole body fat-free mass (Supplementary file 2).
Discussion
We examined the effect of a higher genetic predisposition for Alzheimer’s disease on a broad range of phenotypes from the UK Biobank. To our knowledge, this is the first study to conduct a hypothesis-free phenome scan to investigate the far-reaching causal effects of a polygenic risk score of Alzheimer’s disease on many traits, and to examine these effects by age group in such a large sample. We found that a higher APOE-inclusive polygenic risk score for Alzheimer’s disease was associated with medical history of conditions such as high cholesterol and atherosclerosis, family history of conditions such as diabetes and heart attack, physical measures, biological sample measures, lifestyle and dietary factors. The effects of a higher genetic predisposition for Alzheimer’s disease are stronger in participants of ages 62 to 72 years although the direction of effect is largely similar across age groups. To establish directional causality, we employed two-sample Mendelian randomization to assess whether the effects observed are causes or consequences of the disease process. We found that a genetic liability for higher hip circumference, whole body fat and fat-free mass, trunk and body fat percentage, fluid intelligence, hearing ability, napping during the day, and forced vital capacity lowered the odds of Alzheimer’s disease, while higher self-reported moderate physical activity increased the risk of developing Alzheimer’s disease.
The PheWAS using all Alzheimer’s disease SNPs (including those in the APOE gene) suggested that the genetic risk for Alzheimer’s disease had an effect on a diverse array of phenotypes such as medical history (e.g. high cholesterol and cholesterol-lowering medication), brain-related phenotypes (e.g. higher volume of grey matter in supracalcarine, intracalcarine and cuneal cortices), physical measures (e.g. lower body fat measures), lifestyle (e.g. self-reported daytime napping), and blood measures (e.g. lower red blood cell distribution width). However, these effects appear to be largely driven by the APOE gene, as our sensitivity analysis excluding the APOE region replicated only effects for family history of Alzheimer’s disease and some cognitive measures. Studies in APOE-deficient mice demonstrate the multifunctional role of APOE on longevity-related phenotypes such as changes in lipoprotein profiles [55–57], neurological disorders [58], type II diabetes [59], altered immune response [60], and increased markers of oxidative stress [61]. Similarly, observational studies show that APOE is related to lower levels of high density-lipoprotein, higher levels of high-density lipoprotein [62–64], changes in body mass index [64–67], as well as a higher risk for coronary artery disease and myocardial infarction [68]. Therefore, due to the horizontally pleiotropic nature of the APOE gene, we cannot delineate whether the effects of the polygenic risk score on traits observed in the PheWAS (e.g. atherosclerotic heart disease) are part of biological pathways related to Alzheimer’s disease.
Previous observational studies have found conflicting evidence for the association of cardiovascular risk factors with Alzheimer’s disease depending on the age at which these risk factors were measured. For example, obesity as measured in midlife has been associated with higher risk of dementia [69–71], whereas older age obesity has been associated with a lower risk for Alzheimer’s disease [71–73]. Recently, a large-scale population study in the UK clinical practice research datalink, found that low body mass index in all age groups was associated with an increased risk of Alzheimer’s disease [74]. Similarly, in our study, a higher polygenic risk score for Alzheimer’s disease was associated with lower body mass index, whole body fat mass, whole body fat-free mass, body fat percentage, whole body water mass and trunk fat percentage in participants of ages 52-72 years. The effect of polygenic risk score on these traits was much smaller and consistent with the null for the younger participants. A similar trend in observational studies is also observed for hypertension, where some studies have shown that a higher midlife systolic and diastolic blood pressure elevate the risk of developing dementia [75]. In concordance with some late-life studies which found lower diastolic blood pressure to be associated with higher odds of Alzheimer’s disease [12,76,77], we identified evidence that a higher polygenic risk score for Alzheimer’s disease is associated with lower diastolic blood pressure in the 62-72 years age stratum. Mendelian randomization studies found that a higher systolic [19,78] and diastolic pressure [78] cause lower odds of Alzheimer’s disease, as well as higher odds of vascular brain injury [78]. A different Mendelian randomization study [79], examined the effect of lowering systolic blood pressure on Alzheimer’s disease, employing instruments for different anti-hypertensive medications. They report little evidence that lower systolic blood pressure influences the risk of Alzheimer’s disease, and any effects of the antihypertensive drugs examined are unlikely to affect risk of Alzheimer’s disease solely by lowering systolic blood pressure.
In agreement with some previous Mendelian randomization studies [8,18,79,80], we found little evidence that body mass index and blood pressure influence the risk of developing Alzheimer’s disease. Hence, the association observed in the PheWAS between the polygenic risk score, lower body fat measures and diastolic blood pressure may be an effect of the disease process. We found that a higher self-reported number of days of moderate physical activity increased the odds of Alzheimer’s disease. A Mendelian randomization study [81] also found evidence that a higher moderate vigorous physical activity was associated with a higher risk of Alzheimer’s disease, yet found physical activity increased cerebrospinal fluid Aβ42 levels (indicative of higher cerebral amyloid load [82–84]).Genetic variants associated with lower cerebrospinal fluid Aβ42 levels have been shown to be associated with earlier disease, higher risk for Alzheimer’s disease, as well as faster progression.
Immune and inflammatory processes are speculated to be involved in Alzheimer’s according to recent research on cellular, genetic, and molecular mechanisms of disease development. A recent study [85] identified P.gingivalis, the bacterium causing chronic periodontitis in brains of Alzheimer’s patients. Although we identified little evidence that genetic risk for Alzheimer’s disease was associated with dental infections, we found it to be associated with several phenotypes involving inflammatory pathways such as self-reported wheeze/whistling, monocyte count, and blood-based measures.
We used forced vital capacity as a measured phenotype proximal to self-reported recurrent phenotypes associated with respiratory function (e.g. wheeze/whistling) and the estimates suggested a protective role for Alzheimer’s disease. This is in agreement with previous evidence of modest correlations between the Alzheimer’s disease polygenic risk score and asthma and the polygenic risk score of asthma with Alzheimer’s disease [86]. The Finnish Cardiovascular Risk Factors, Aging, and Dementia study, which followed 2000 participants for 20 years, from midlife to late life, found an association between asthma in midlife and a higher risk of dementia, which attenuated after adjustment for cardiovascular risk factors [87]. In another study, there was still evidence of an association, even after adjustment for medical comorbidities and use of inhaled steroids [88]. Forced vital capacity may be linked to Alzheimer’s disease through various mechanisms. Poor lung function may increase the risk of Alzheimer’s disease through chronic hypoxia resulting in the increase of Aβ production and reduction in the degradation of this protein [89] and the development of ischemic damage to the brain. For example, individuals with poor respiratory function are more likely to develop white matter lesions and lacunar infarcts [90]. Another potential mechanism could be through inducing a pro-inflammatory state, as individuals with low lung function have higher levels of C-reactive protein [91] which has been shown to increase the risk of dementia [92].
A study in UK Biobank [93] found that genetic variants associated with red blood cell distribution width are linked to autoimmune disease (e.g. type 1 diabetes, rheumatoid arthritis), as well as traits related to ageing (e.g. Alzheimer’s disease, macular degeneration and longevity). In agreement with our findings, they found that the polygenic risk score for Alzheimer’s disease was associated with lower red blood cell distribution width, an effect which attenuated after exclusion of the APOE locus [93]. Indicators of relatively poor red blood cell function, as well as anaemia were associated with lower cognitive function and Alzheimer’s disease in individuals from AddNeuroMed and UK Biobank [94]. In our study, red blood cell indices show the earliest evidence of association with the genetic risk of Alzheimer’s disease, but we found little evidence that these measures caused Alzheimer’s disease using Mendelian randomization indicating that cell composition changes may be an early consequence of Alzheimer’s disease pathophysiology or downstream of related behavioural changes.
We found evidence that a polygenic risk score for Alzheimer’s disease was associated with a lower fluid intelligence score, as previously reported [95] but not educational attainment. Although previous Mendelian randomization studies have suggested that higher educational attainment causes lower odds for Alzheimer’s disease [7,8,96], a recent multivariable Mendelian randomization study found little evidence that educational attainment directly increased risk of Alzheimer’s disease over and above the underlying effects of intelligence [6]. Another Mendelian randomization study which studied the relationship between traits previously linked to Alzheimer’s disease in observational studies found that higher education delayed age of onset of Alzheimer’s disease [78]. However, they found little evidence that education is causally linked to Alzheimer’s neuropathology and cerebrospinal fluid biomarkers, suggesting that the effects are due to a larger cognitive reserve rather than through pathological changes related to Alzheimer’s disease [78].
We identified suggestive evidence of a bidirectional relationship between sleep and Alzheimer’s disease. Self-reported daytime napping causally reduced risk of Alzheimer’s disease and a higher genetic risk for Alzheimer’s resulted in changed sleeping patterns (e.g. less napping during the day, lower sleep duration). To date, there is accumulating evidence implicating sleep in Alzheimer’s disease, but the directionality of this relationship is unclear [97]. Observational studies have shown that increased sleep fragmentation is associated with cognitive impairment and dementia [98–100]. However, their follow-up periods were too short to ensure that pathophysiological changes related to Alzheimer’s had not already started [3]. Mouse models suggest this relationship may be bidirectional as accumulation of Aβ protein may cause sleep disturbances and disrupted sleep may increases the risk of Aβ accumulation [101–103].
Strengths and limitations
The large sample of UK Biobank provided unparalleled statistical power to investigate the phenotypic manifestation of a higher genetic predisposition for Alzheimer’s disease, by age group, and to follow-up these hits using Mendelian randomization. Furthermore, the systematic approach of searching for effects using PheWAS reduces bias associated with hypothesis-driven investigations and reduces publication bias as all findings are published and not only the most “significant” [35]. However, a consideration for the use of PHESANT is that it uses a rule-based method to test the association of the exposure with each outcome and it is likely the transformation applied may have been inefficient for some phenotypes (e.g. rare binary traits/diseases) and may have reduced power. Furthermore, although polygenic risk scores were derived using variants associated at genome-wide significance level, they can still have horizontal pleiotropic effects on different disorders and traits.
For Mendelian randomization analyses, we used non-overlapping samples (UK Biobank and meta-analysis (IGAP, ADSP, and PGC ALZ)), minimising bias in the causal estimates [104]. However, instruments for Mendelian randomization were largely based on GWAS from self-reported measures which may have introduced reporter bias. For example, self-reported physical activity is a complex measure which is likely to capture social and psychological factors, and hence further research should use instruments proxying the metabolic equivalent of task or accelerometer data available in UK Biobank. Mendelian randomization estimates generally reflect the lifetime effects of a phenotype, rather than the effect of phenotype at a specific age or time [105]. Thus, it is challenging to identify when putative risk factors affect risk of Alzheimer’s disease (e.g. red blood cell distribution width).
Our results could be explained by collider bias, which may have been introduced into our study through selection of the study sample. Collider bias can occur by either a) restricting a sample or b) adjusting a statistical model for a common effect of two variables of interest. The UK Biobank includes a highly selected, healthier sample of the UK population [106]. Compared to the general population, participants were less likely to be obese, to smoke, to drink alcohol on a daily basis, and had fewer self-reported medical conditions [107]. Selection bias may occur if both having a lower genetic predisposition to Alzheimer’s disease and a specific trait (e.g. higher education, lower BMI) affect participation in the study. This could induce an association between genetic risk for Alzheimer’s disease and the traits in our study [108].
A further source of collider bias is survival bias, a limitation of studies estimating the causal effects of exposures and outcomes associated with mortality [109,110]. If both the polygenic risk score for Alzheimer’s disease and the examined traits associate with survival, sampling only living people can induce spurious associations that do not exist in the general population. Such bias may have affected our findings for body mass, as heavier individuals and those with higher values of the Alzheimer’s polygenic risk score are less likely to survive and participate in UK Biobank. The polygenic risk for Alzheimer’s disease in our analysis was associated with lower age at recruitment, suggesting that older people with high values of the score are less likely to participate. Thus, we cannot be certain whether the associations of the polygenic risk score with phenotypes such as body mass index are due to a causal effect or some form of selection bias.
Conclusion
In this phenome-wide association study, we identified that a higher genetic predisposition for Alzheimer’s disease is associated with 165 phenotypes of 15,403 UK Biobank phenotypes, highlighting established and novel associations. Mendelian randomisation analysis follow-up of phenotypes identified in our PheWAS hits and in previous observational studies, showed evidence that only 10 of these factors were implicated in the aetiology of Alzheimer’s disease. We found little evidence that the remaining 155 phenotypes were driving the disease process, but rather our results indicate reverse causation or selection bias. Further research should exploit the full array of potential relationships between the genetic variants implicated in Alzheimer’s disease, intermediate phenotypes, and clinical phenotypes by using genetic, transcriptomic, proteomic and phenotypic data to identify potential biological pathways and to strengthen and widen evidence for causal risk factors of Alzheimer’s disease.
Data Availability
UK Biobank data are available through a procedure described at http://www.ukbiobank.ac.uk/using-the-resource/.This research was conducted using the UK Biobank Resource applications 16729, and complied with all relevant ethical regulations.Summary results of genome-wide association analysis are available at the University of Bristol data repository.
Funding
RKL was supported by a Wellcome Trust PhD studentship (Grant ref: 215193/Z18/Z). The Medical Research Council (MRC) and the University of Bristol support the MRC Integrative Epidemiology Unit [MC_UU_12013/1, MC_UU_12013/9, MC_UU_00011/1]. The Economics and Social Research Council (ESRC) support NMD via a Future Research Leaders grant [ES/N000757/1]. LDH is funded by a Career Development Award from the UK Medical Research Council (MR/M020894/1). LACM is funded by a University of Bristol Vice-Chancellor’s Fellowship. The funders had no role in study design, data collection and analysis, decision to publish, or preparation of the manuscript.
Acknowledgments
This research has been conducted using the UK Biobank Resource under Application Number 16729. The MRC IEU UK Biobank GWAS pipeline was developed by B.Elsworth, R.Mitchell, C.Raistrick, L.Paternoster, G.Hemani, T.Gaunt (doi: 10.5523/bris.pnoat8cxo0u52p6ynfaekeigi).We acknowledge the members of the Psychiatric Genomics Consortium (PGC). The Alzheimer’s Disease Sequencing Project (ADSP) comprises 2 Alzheimer’s Disease (AD) genetics consortia and 3 National Human Genome Research Institute (NHGRI)-funded Large Scale Sequencing and Analysis Centers (LSAC). The 2 AD genetics consortia are the Alzheimer’s Disease Genetics Consortium (ADGC) funded by the NIA (U01 AG032984), and the Cohorts for Heart and Aging Research in Genomic Epidemiology (CHARGE) funded by the NIA (R01 AG033193), the National Heart, Lung, and Blood Institute (NHLBI), other NIH institutes, and other foreign governmental and nongovernmental organizations. The Discovery Phase analysis of sequence data is supported through UF1AG047133 (to G. Schellenberg, L.A. Farrer, M.A. Pericak-Vance, R. Mayeux, and J.L. Haines); U01AG049505 to S. Seshadri; U01AG049506 to E. Boerwinkle; U01AG049507 to E. Wijsman; and U01AG049508 to A. Goate. Data generation and harmonization in the Follow-up Phases is supported by U54AG052427 (to G. Schellenberg and Wang). The ADGC cohorts include Adult Changes in Thought (ACT), the Alzheimer’s Disease Centers (ADC), the Chicago Health and Aging Project (CHAP), the Memory and Aging Project (MAP), Mayo Clinic (MAYO), Mayo Parkinson’s Disease controls, the University of Miami, the Multi-Institutional Research in Alzheimer’s Genetic Epidemiology Study (MIRAGE), the National Cell Repository for Alzheimer’s Disease (NCRAD), the National Institute on Aging Late Onset Alzheimer’s Disease Family Study (NIA-LOAD), the Religious Orders Study (ROS), the Texas Alzheimer’s Research and Care Consortium (TARC), Vanderbilt University/Case Western Reserve University (VAN/CWRU), the Washington Heights-Inwood Columbia Aging Project (WHICAP) and the Washington University Sequencing Project (WUSP), the Columbia University Hispanic–Estudio Familiar de Influencia Genetica de Alzheimer (EFIGA), the University of Toronto (UT), and Genetic Differences (GD). The CHARGE cohorts with funding provided by 5RC2HL102419 and HL105756, include the following: the Atherosclerosis Risk in Communities (ARIC) Study which is conducted as a collaborative study supported by NHLBI contracts (HHSN268201100005C, HHSN268201100006C, HHSN268201100007C, HHSN268201100008C, HHSN268201100009C, HHSN268201100010C, HHSN268201100011C, and HHSN268201100012C), the Austrian Stroke Prevention Study (ASPS), the Cardiovascular Health Study (CHS), the Erasmus Rucphen Family Study (ERF), the Framingham Heart Study (FHS), and the Rotterdam Study (RS). The 3 LSACs are the Human Genome Sequencing Center at the Baylor College of Medicine (U54 HG003273), the Broad Institute Genome Center (U54HG003067), and the Washington University Genome Institute (U54HG003079). Biological samples and associated phenotypic data used in primary data analyses were stored at Study Investigators institutions and at the National Cell Repository for Alzheimer’s Disease (NCRAD, U24AG021886) at Indiana University funded by the NIA. Associated Phenotypic Data used in primary and secondary data analyses were provided by Study Investigators, the NIA-funded Alzheimer’s Disease Centers (ADCs), and the National Alzheimer’s Coordinating Center (NACC, U01AG016976) and the National Institute on Aging Genetics of Alzheimer’s Disease Data Storage Site (NIAGADS, U24AG041689) at the University of Pennsylvania, funded by the NIA and at the Database for Genotypes and Phenotypes (dbGaP) funded by the NIH. This research was supported in part by the Intramural Research Program of the NIH and the National Library of Medicine. Contributors to the Genetic Analysis Data included Study Investigators on projects that were individually funded by the NIA and other NIH institutes, and by private U.S. organizations, or foreign governmental or nongovernmental organizations. We also thank the International Genomics of Alzheimer’s Project (IGAP) for providing summary results data for these analyses. The investigators within IGAP contributed to the design and implementation of IGAP and/or provided data but did not participate in analysis or writing of this report. IGAP was made possible by the generous participation of the control subjects, the patients, and their families. The i–Select chips was funded by the French National Foundation on Alzheimer’s disease and related disorders. EADI was supported by the LABEX (laboratory of excellence program investment for the future) DISTALZ grant, Inserm, Institut Pasteur de Lille, Université de Lille 2 and the Lille University Hospital. GERAD was supported by the Medical Research Council (Grant n° 503480), Alzheimer’s Research UK (Grant n° 503176), the Wellcome Trust (Grant n° 082604/2/07/Z) and German Federal Ministry of Education and Research (BMBF): Competence Network Dementia (CND) grant n° 01GI0102, 01GI0711, 01GI0420. CHARGE was partly supported by the NIH/NIA grant R01 AG033193 and the NIA AG081220 and AGES contract N01–AG–12100, the NHLBI grant R01 HL105756, the Icelandic Heart Association, and the Erasmus Medical Center and Erasmus University. ADGC was supported by the NIH/NIA grants: U01 AG032984, U24 AG021886, U01 AG016976, and the Alzheimer’s Association grant ADGC–10–196728.
Data and code availability
The data in the current study were partly provided by the UK Biobank Study (www.ukbiobank.ac.uk), received under UK Biobank application no. 16729. Scripts are available on Github at: https://github.com/rskl92/AD_PHEWAS_UKBIOBANK.
References
- 1.↵
- 2.↵
- 3.↵
- 4.↵
- 5.↵
- 6.↵
- 7.↵
- 8.↵
- 9.↵
- 10.
- 11.
- 12.↵
- 13.
- 14.
- 15.↵
- 16.↵
- 17.↵
- 18.↵
- 19.↵
- 20.↵
- 21.↵
- 22.↵
- 23.↵
- 24.↵
- 25.↵
- 26.↵
- 27.↵
- 28.↵
- 29.↵
- 30.↵
- 31.↵
- 32.↵
- 33.↵
- 34.↵
- 35.↵
- 36.↵
- 37.↵
- 38.↵
- 39.↵
- 40.↵
- 41.↵
- 42.↵
- 43.↵
- 44.↵
- 45.↵
- 46.↵
- 47.↵
- 48.↵
- 49.↵
- 50.↵
- 51.↵
- 52.↵
- 53.↵
- 54.↵
- 55.↵
- 56.
- 57.↵
- 58.↵
- 59.↵
- 60.↵
- 61.↵
- 62.↵
- 63.
- 64.↵
- 65.
- 66.
- 67.↵
- 68.↵
- 69.↵
- 70.
- 71.↵
- 72.
- 73.↵
- 74.↵
- 75.↵
- 76.↵
- 77.↵
- 78.↵
- 79.↵
- 80.↵
- 81.↵
- 82.↵
- 83.
- 84.↵
- 85.↵
- 86.↵
- 87.↵
- 88.↵
- 89.↵
- 90.↵
- 91.↵
- 92.↵
- 93.↵
- 94.↵
- 95.↵
- 96.↵
- 97.↵
- 98.↵
- 99.
- 100.↵
- 101.↵
- 102.
- 103.↵
- 104.↵
- 105.↵
- 106.↵
- 107.↵
- 108.↵
- 109.↵
- 110.↵


